: 2020 PRODUCER PRICE")

The probability for producer price increases early in 2020 is high, but it is a double-edged sword.
EXECUTIVE SUMMARY:
A. International dairy product price levels are high and will make imports less attractive.
B. The Global Dairy Trade Index downward momentum slowed down in July and August. In September and October, the trend changed with the index increasing slightly in both months, while November provided robust upward momentum. This is a confirmation of uncertainty regarding export availability and reflects some nervousness in the market that manifested in the high international dairy product prices.
C. Cumulative unprocessed milk production in the dairy heavyweight countries and regions are way down in 2019 compared to previous years.
D. Apart from the United Kingdom and the United States, where producer prices are on a noteworthy upward trend, the other countries don’t exhibit a clear price trend. This is somewhat surprising when contrasted against the low growth in unprocessed milk production in the major dairy exporting countries.
E. The low producer price for unprocessed milk in South Africa, together with the price increases of yellow maize and soya beans reduced the milk to feed price ratio to below 1,2:1 for the past two months.
F. Taking cognisance of the negative effect of the low milk to feed price ratio on on-farm margins, the October 2019 production of unprocessed milk was an all-time production record (343 000 tonnes)(estimate), which seems to fly in the face of on-farm margin levels being negative. This could suppress the upward momentum in producer prices.
G. If producer prices increase at a faster rate than processor and retail prices, the risk of deep producer price cuts five months down the line is high. This is the double-edged sword when producer prices are in an upward cycle.
H. There are clear indications that consumer disposable income is low and the South African gross domestic product (GDP) contracting with 0,6% in the third quarter of 2019 indicates weak consumer demand for some time. Ultra high temperature treated (UHT) and flavoured milk year-on-year September volume sales reduced, respectively, with 9,3% and 6,2%.
The primary industry will be prudent to plan for unprocessed milk growth of less than two per cent in 2020. In the past, the South African market could not absorb higher growth at the price levels then in place, resulting in deep producer price cuts. Market demand will be even more subdued due to a prolonged weak South African economy.
Major Afflecto’s:
1. International dairy product price levels (inclusive of November 2019)
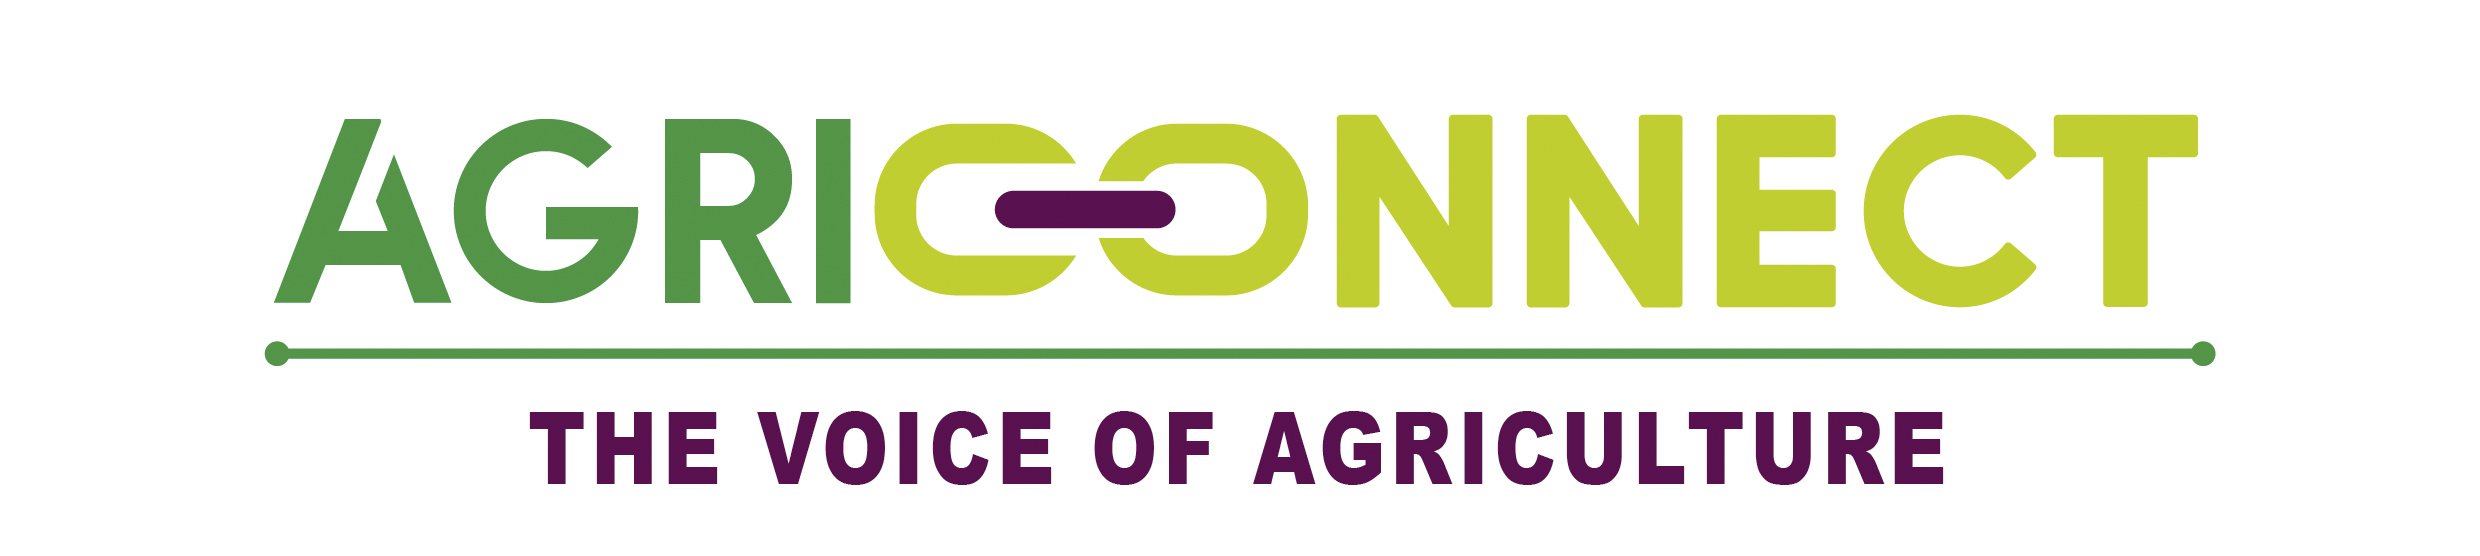
International dairy product prices in November 2019 is higher than a year ago. Butter and Cheddar prices are only slightly higher, respectively 7% and 11%, while skimmed milk powder (SMP) and full cream milk powder (FMP) prices are 50% and 25% higher, respectively. The higher price levels should support producer price levels and increase the cost of imports.
Figure 1: International dairy product price levels (source: USDA)
2. Global Dairy Trade Index
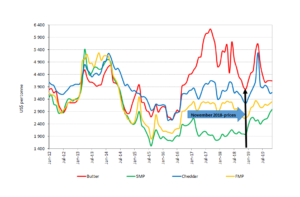
The figure below, shows the movement of the Global Dairy Trade (GDT) price index, inclusive of November 2019. The index is 23% higher than a year ago. The index is exhibiting the same trends as the international dairy product prices. The index is the aggregate of nine dairy products with butter, SMP, FMP, and Cheddar providing the bulk of the index.
The downward momentum of the index slowed down in July and August. In September and October, the trend changed with the index increasing slightly in both months, while November provided robust upward momentum. This is a confirmation of uncertainty regarding export availability and reflects some nervousness in the market.
Figure 2: Global Dairy Trade Index (source: Global Dairy Trade)
3. International milk production in the major dairy exporting countries
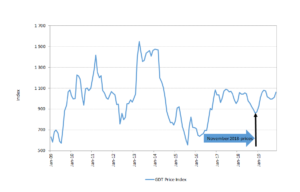
Table 1: Changes (%) in cumulative unprocessed milk production in the major dairy exporting countries and South Africa 2015 – 2019 (2019 only first 9 months). South Africa’s first 10 months, last two are preliminary (source: CLAL and Milk SA)
It is evident from the above table that cumulative production during 2019 in the dairy heavyweight countries and regions are way down compared to previous years. The main drivers behind the reduced growth are climate challenges and structural industry changes. The above data is the main contributing factor to the market jitters and the resultant higher international dairy product prices.
It is clear that the growth factor in unprocessed milk production in the major dairy exporting countries is small compared to that of South Africa. The typical percentages are one and two per cent over the last four years, indicating that these power houses in the international market strategize to limit unprocessed milk expansion despite being major players in the international market. There could be various market factors and a combination of factors creating this phenomenon, but most probably the ability to off-load higher supply disrupts the market significantly – prices taking a dive.
4. International producer price levels for unprocessed milk
Table 2: Calculated producer prices of unprocessed milk (left column) in selected countries October 2019 and 12 months rolling price (right column) (Prices in Euro/100kg) (source: LTO Netherland)
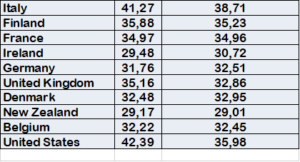
In the above table, six of the ten countries registered higher prices in October 2019 than the 12 months rolling prices. However, the intensity of the price increases varies between minuscule to significant percentages. The average European price in 2019 is lower than the 2018 price. Apart from the United Kingdom and the United States, where producer prices are on a noteworthy upward trend the other countries don’t exhibit a clear price trend. This is somewhat surprising when contrasted against the low growth in unprocessed milk production in the major exporting countries. The producer price in Poland is the lowest of the European countries at €30,90 per 100 kg, bar Ireland.
5. South African milk production in 2019
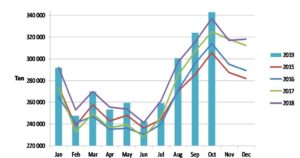
Unprocessed milk production for October 2019 is estimated at 332 million litres, 1,7% more than in October 2018. The comparative growth percentage for October 2018 was 3,7% and 3,5% for October 2017. Cumulative unprocessed milk production for 2019, inclusive of October is 2 705 million litres registering a growth of only 0,53%. Compared over the same period in 2018 the growth was 5,8%.
It seems that the overhang of dairy stocks that was created by the strong unprocessed milk production growth of 4,8% in 2018 adequately buffered the current low growth in production to still meet demand. Demand might be more under pressure than realised. In the past, the South African market could not absorb unprocessed milk growth of more than 3% and that lead to a downward cycle in producer prices. These cycles are often overstated due to the nature of milk production planning in the primary sector. The primary sector will do themselves a favour if they plan for moderate production growth. The recent level of culling that took place due to thin or negative on-farm margins would assist in lower production growth.
Figure 3: South African milk production in 2015 – Oct 2019 (source: 2015 – Oct 2019 Milk SA returns; Sep – Oct 2019 , Milk SA estimates)
6. Producer, processor, and retail price indices, Jan 2012 – Aug 2019
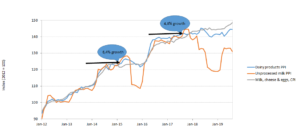
The indices in the graph below provides for interesting reading. As soon as the producer price index (red line) increases at a faster rate than the processor (blue line) and retail price (green line), unprocessed milk production overshoots what the market can absorb at those price levels. The result is deep cuts in the producer price that can clearly be observed in the graph.
This is where the risk of a double-edged sword materialises. If producer prices increase at a faster rate than the other role players in the value chain, the risk of wide swings in the producer price is high. The increments and timing of increases are complex due to outside and unknown factors like the climate and the value of the Rand.
Figure 4: Producer, processor, and retail price indices, Jan 2012 – Aug 2019 (source: Stats SA. The percentages in the blue bubbles are the growth in unprocessed milk production in 2015 and 2018 source: Milk SA)
7. South African milk price to feed price ratio
The low producer price for unprocessed milk together with the price increases of yellow maize and soya beans reduced the ratio to below 1,2:1 for the past two months. At this level, the majority of dairy farmers will not break-even and will have to fund their operations from equity or borrowings, if available. The double dip in the above ratio that farmers experienced in the first ten months of 2019 will have a prolonged effect on supply in the coming months and in the next season.
Figure 5: South African milk price to feed price ration
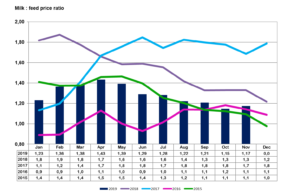
Taking cognisance of the above negative effect on on-farm margins, October 2019 production was an all-time unprocessed milk production record, which seems to fly in the face of on-farm margin levels being negative. However the resultant milk flow should be interpreted, while allowing for production planning at farm level that occurs during mating season some nine months earlier and the structural changes that occurred in dairy farming over the last couple of years. Large dairy farms react differently to lower or negative farm returns than smaller farms and solitaire dairy farming businesses, which do not have the flexibility of a diversified operation.
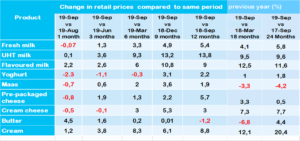
8. South African dairy demand dynamics
In September 2019 versus September 2018, six of the nine dairy products being measured suffered reduced sales. One on these products is UHT milk that plays a significant role in dairy demand. The year-on-year September price increases for five of these products were higher than inflation. These price increases should provide some headroom for producer price increases.
The GDP third quarter of 2019 indicated that the South African economy contracted by 0,6%. Without spending too much time on the South African economy, it suffices to say that it is weak and will not recover easily. Government has limited room to apply the right medicine, thus it will be done in small dosages or not at all.
Table 3a: South African dairy demand dynamics (source: Nielson’s as supplied by SAMPRO)
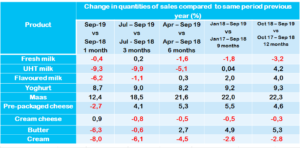
Table 3b: South African dairy demand dynamics (source: Nielson’s as supplied by SAMPRO)
Bertus van Heerden, chief economist, Milk Producers’ Organisation (MPO)
Published on Monday, 9th December 2019 - 08:00
Recent Posts
disclaimer