

MPO Pointer 8/1 JULY 2020
For the past five years, erratic producer prices for milk farmers all but wiped out dairy farm resilience and increased the rate at which dairy farms closed down. Although the industry exhibited growth in terms of volume produced (on average 2,1% per year over the period), it came at a cost that destroyed wealth at farmer and farm labourer level. To use the yard stick of growth in unprocessed milk production to determine the state of the primary industry is not an exact science.
The very fact of the farmer’s ability to switch production on and off provides background. A wide range of market factors limit the manoeuvring space of the dairy farmer to react to wide fluctuating price signals. The severity of negative farm economics will differ between dairy farm operations depending on the microclimate conditions, production systems, and milk buyer. The high degree of price volatility behind the scenes is also placing role player’s viability and market operations in jeopardy.
The widening gap between what a dairy farmer receives and what consumers pay for dairy products is only one of the curtain-raisers in the dairy value chain show. The level of erratic price behaviour at farmer level is illustrated by using a linear regression fit to determine a trend. R-squared (R2) is a measure of how well a regression model fits the data. It can be interpreted as the proportion of variance explained by the regression model. It is a number between 0 and 1 (0 ≤ R2 ≤ 1). The closer its value is to 1, the more variability the model explains.
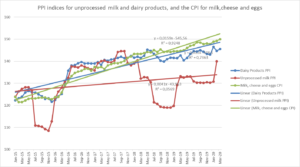
Source: Statistics South Africa
It is clear from the graph above that a linear regression is not a good fit for determining a trend in producer prices, while it provides a good fit for the other two indices, namely dairy product prices and retail prices for milk, cheese, and eggs. Nevertheless, the basic regression is indicating some trend in play to help with planning for the two role players downstream from the dairy farmer. Producer prices are not only influenced by market factors but could also be influenced by the specific circumstances of a processor or retailer.
While testing other regressions (exponential, logarithmic, polynomial, and to the power of) only the polynomial regression provided some fit, although still at a low R-square (graph below). The trend is actually turning south from January 2018 due to producer prices dropping sharply from November 2017, never to fully recover. The time series used is short for a polynomial regression but serves well to help understand the position of the dairy farmer.
With producer prices behaving as they did over the past five years, business planning at primary level is impossible, with dairy farmers only focusing on survival actions and survival strategies. Once a farming operation is faced with this situation, socio-economic actions subside, regulation adherence gets paper thin, and optimisation comes second to cost-cutting activities. The primal challenge for survival kicks-in.
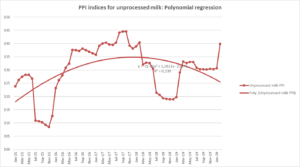
Source: Statistics South Africa
Table 1: Index changes – yearly per month of January (%)
| Month | Dairy products PPI | Unprocessed milk PPI | CPI milk, cheese, and eggs |
| Jan 2016 | 0,20 | −8,00 | −0,10 |
| Jan 2017 | 13,50 | 21,00 | 11,10 |
| Jan 2018 | 2,00 | 1,30 | 4,20 |
| Jan 2019 | −0,10 | −14,00 | 0,85 |
| Jan 2020 | 3,54 | 9,60 | 3,00 |
The difference in price behaviour between the three indices is emphasised in Table 1. Negative price changes (reduced prices) during the five observations for the downstream role players in the value chain only occurred once and at a miniscule percentage of −0,1%. Dairy farmers had to contend with two negative price changes over the same period of at least 799 basis points higher than the one negative price change for dairy processors and retailers.
Drilling down some more, over the period January 2015 to March 2020, the highest level of negative price change for dairy processors on the basis of the same month the previous year was −2,6% (May 2019) and for retailers −1,9% (Feb 2015), while for dairy farmers it was −17,6% (Nov 2018). The highest level of price increase occurred also at dairy farmer level, merely underpinning the price swings farmers have to cope with.
In analysing whether these indices at least move in the same direction (if producer prices reduce the rest follows), it was found that in only 33% of the months from January 2015 to March 2020 this was the case. This is considered to be paramount to the challenge to create a predictable trend in farmer prices and drive consumer demand.
According to the three indices (the PPI for dairy products, the PPI for unprocessed milk, and the CPI for milk, cheese, and eggs) as published by Statistics South Africa, for the period from January 2015 to January 2020, the indices increased by 19,8%, 6,4%, and 20,0%, respectively. Assuming that in 2019, the base price for the different indices was R14,00, R4,30, and R21,00, respectively; the rand amount of the increases equates to R2,77 for processors, R0,28 for dairy farmers, and R4,20 for retailers. This calculation illuminates the order of magnitude when comparing percentage increases between the three role players in the value chain, which needs to receive more emphasis when prices are ‘negotiated’; (please note, these values are estimates and do not include the whole dairy product basket).
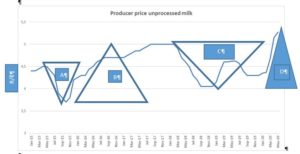
Producer prices are calculated by the MPO based on information supplied by members and other role players and reflect a national average. The graph below is a time series from January 2015 to May 2020. The time series corresponds largely with the indices of Statistics South Africa. Triangle A gave rise to triangle B, B to C, and C to D. Triangle B was the result of too deep price cuts of producer prices, as shown in triangle A.
Increased farmer prices during triangle B struggled to stimulate milk flow, but once the tipping point was reached and the brakes were put on during triangle C, milk flow kept up and led to producer prices being throttled for a period of 20 months. The result is the birth of triangle D (which is still in play), where milk flow is sluggish to react to increased producer prices. It is important to note that to turn milk production in the primary industry on or off is not the same as flipping a switch … but everyone knows that, right!
Increased producer prices (triangle D) from most processors were announced on a wide front, some effective from 1 March 2020 and others from the beginning of April. The price of milk solids also increased in both months, together with an overall improvement in milk solids.
The above narrative indicates a situation where stability regarding producer prices needs to return to the value chain against the backdrop of a primary industry that needs to recover from negative farm economics during 2018 and 2019. This on its own is bad enough, but we are also in the midst of a pandemic.
During the first 70 days of the restrictive lockdown period, demand for dairy products maintained a good position in the consumer basket. The inherent nutritional value of dairy played an important role in this achievement. Some import replacement is taking place, improving demand. It is important to note that dairy demand between processors could differ, depending on the product mix output of the processor.
In normal circumstances, the industry would have a reasonable idea of demand growth (2–2.5% growth per year). The current circumstances, through the South African economy contracting by 7,2% in real terms in 2020 (South African treasury estimate), introduces too many unknowns. Stimulus and relief packages from the government and the cost of credit at a 50-year low introduce even more uncertainty, with specific reference to consumer disposable income.
The level of demand is uncertain due to drastic changes in economic activity and the consequential influence on consumer disposable income. At a macro level, total demand for dairy products should be less, with some products being affected more than others. However, retail pricing could utilise demand elasticity present in most dairy products to reduce the magnitude in demand shift. To avoid major swings in the dairy value chain, the flow of information from the retailer via the processor to the dairy farmer should be a focus point.
Haak en steek
- The price volatility in producer prices must reduce to ensure the viability of the total industry and dairy food security.
- The value chain needs to prevent triangle D from happening. Real developments in all three role players should be transparent and dynamic, including the weekly flow of information between retailers, milk processors, and dairy farmers. Next-level communication platforms can make it happen and it is inexpensive.
- The supply by dairy farmers to milk buyers should adhere to planned offtake.
- Dairy farmers need to understand the uncertainty regarding demand and should drive producer price optimisation and not volume turnover. The need for turnover is well acknowledged, but current circumstances beg for a rethink.
- The MPO undertakes to drive the principal of demand elasticity with retailers. The buy-in of retailers alone will not be enough, primary industry will need to monitor supply carefully.
- The MPO, through Agri Inspec, will continue vigilant import monitoring and container inspections.
The MPO is planning zoom meetings to expand on the Pointer and discuss the Pointer.
Bertus van Heerden, chief economist, Milk Producers’ Organisation (MPO)
Published on Thursday, 2nd July 2020 - 10:59
Recent Posts
disclaimer