

MPO POINTER 7/25 November 2021
WHY SOUTH AFRICAN DAIRY FARMERS ARE FAILING TO COMPETE WITH IMPORTED DAIRY PRODUCTS
It is often argued that the ability of the local milk industry to grow or even to survive will be dependent on the extent to which the local milk industry will be able to compete with imported milk products. This statement largely exposes the vulnerable position of the South African dairy farmer. Too often, margins lost among dairy processors emanating from cheap (often subsidised) imported milk products is pushed back onto milk producers through reduced farm gate prices for milk. This is one of the main reasons why so many producers left dairy production in recent years, and those remaining realising that the only way to survive is to increase the scale of operation (which often is incorrectly used as evidence of increased concentration).
For years, the Milk Producers’ Organisation (MPO) has argued that the level of free on board (FOB) prices of imported dairy products from the European Union (EU), Ireland, eastern European Countries and the United Kingdom seems unrealistic and unfair. This is mainly due to large funds that subsidise farmers and dairy producers in Europe. There are five EU funds that support agricultural and rural development on top of the many direct payments to farmers under the Common Agricultural Policy. These funds include the European Regional Development Fund (ERDF) – regional and urban development; European Social Fund (ESF) – social inclusion and good governance; Cohesion Fund (CF) – economic convergence by less-developed regions; the European Agricultural Fund for Rural Development (EAFRD) and the European Maritime and Fisheries Fund (EMFF). Recently, subsidies for Sustainable Energy Projects were also introduced. Programmes and applications of these funds reduce costs in the value chains and enable European countries to make products and commodities available on the international market at reduced (unfair) prices. Subsidies are paid to farmers in Europe as outlined in the Common Agricultural Policy. In 2017, €41 billion was paid to farmers and, in 2020, the amount grew to an estimated €59 billion – a growth of nearly 15% per year.
Fair competition between companies and countries around the world drives the optimal allocations of production factors that enable markets to discover price levels for different production factors based on demand, reflecting scarcity. Unfair competition because of subsidies by governments, distort these markets, spilling over into improper economic policy, reduced economic growth and wealth creation. In the end, this destroys a country’s ability to achieve food security or to enter the export market.
Notwithstanding the absence of binding competition rules within the World Trade Organization (WTO), competition concerns have long been a fundamental question within the international trading system. Even though competition policy was deleted from the Doha agenda, anticompetitive practices continue to attract attention. Therefore, several international institutions such as the Organization for Economic Cooperation and Development (OECD), the International Competition Network (ICN), the United Nations Conference on Trade and Development (UNCTAD), and the WTO-actively discuss the creation of international frameworks to shape competition policy.
A striking similarity exists between the objectives of the WTO and those of competition policy laws in certain countries. The key concepts common to both are, inter alia, promotion of an open market, provision of fair and equal business opportunities to every participant in the market, transparency and fairness in the regulatory process, the promotion of efficiency, and the maximisation of consumer welfare.
This note proceeds from the premises that important synergies exist between economic, trade and international competition laws and that it is reasonable to charge that a fresh reflection and overhaul on related issues are necessary when, for example, the South African dairy industry is analysed.
Our analysis of import data of dairy products for the first nine months of 2021 provides ample evidence to suspect foul play in the market for dairy products. Ireland and the Netherlands are jointly responsible for 91% of all Cheddar imports into South Africa between January and December 2021. To assess the ‘fair pricing’ of these imports we estimate in Table 1 the cost of the milk needed to manufacture one kilogram of Cheddar cheese (column E) is calculated, based on the different farmer prices in each of the particular countries. The conversion factor of milk to Cheddar cheese is 9,52 litres of milk to manufacture one kilogram of Cheddar. In column C, the FOB price that was paid for the imported Cheddar is indicated. The FOB-price is the price in the harbour of export, excluding loading, freight, and insurance costs. In all the import transactions individually analysed from the three countries involved, the cost of only the milk component exceeds the FOB price in column C, which is the FOB price paid by the importer in South Africa. A backward estimation of the landed FOB price of Cheddar versus the cost of the milk component alone leaves no money available to cover the following costs:
- Cheddar manufacturing cost;
- packaging material;
- storage cost;
- time value of money during storage;
- transport to the harbour and offloading in the harbour; and
- agents commission.
There is also no profit margin available for the manufacturer.
Table 1 Cheddar Imports from January 2021 to September 2021
| A | B | C | D | E |
| Country of origin | Volume (tonnes) | Average FOB price/kg | Average Farmer price R/ℓ
(Jul 2020–Sept 2021) |
Cost of milk needed to manufacture one kg of Cheddar |
| Ireland | 452 | 59,42 | 7,03 | 66,93 |
| Netherland | 660 | 60,10 | 6,69 | 63,69 |
| France | 21 | 46,78 | 6,91 | 65,78 |
| Total | 1 133 | – | – | – |
| Total all Cheddar | 1 236 | – | – | – |
(Source: SARS as supplied by Agri Inspec; European Commission)
Over the period July 2019 to September 2021 the lowest price paid to farmers in Ireland was R6,51, in the Netherlands R6,40, and in France R6,38. Even at these lowest prices for the milk, the finding in Table 1 still holds true.
Who then carries these costs and profit margin? One can only speculate that programmes from the EU funds provide cost saving opportunities that enable these manufacturers to remain viable and profitable. This is, however, at the expense of many dairy farmers across the world, mostly in poorer countries where money for subsidies is not available.
To drive the point home: it is easy to state that an industry must be able to compete with imported products and brush over it as a “don’t worry the market will sort it out”, is too simplistic. What is missing is to include the words fair priced imports and that resonates well with international law on competitive behaviour.
In Table 2, we analyse imported ultra-high temperature (UHT) processed milk from Poland, who is responsible for 74% of all UHT processed milk imports for the period under review. Column C provides the FOB prices for the UHT import transactions from Poland on a monthly basis. In column D, the prices paid to farmers for milk in Poland is reflected. One can assume that there will be a lag between the month of manufacturing the UHT processed milk, exporting it and the month in which the milk was purchased from the corresponding price paid to farmers in that month. Nevertheless, the margin, reflected in column E, being the difference between C and D will suffice to enable the following analyses to be significant in reflecting certain anomalies.
Table 2 UHT milk imports from Poland. Jan–Sept 2021
| A | B | C | D | E |
| Month | Volume (kg) | FOB Price (R/kg) | Price paid to farmers (R/kg) | Margin left to cover all other cost |
| Jan | 938 400 | 8,87 | 6,07 | 2,80 |
| Feb | 1 224 000 | 8,94 | 5,89 | 3,05 |
| Mar | 612 000 | 8,75 | 5,86 | 2,89 |
| Apr | 612 000 | 8,54 | 5,71 | 2,83 |
| May | 1 674 896 | 8,38 | 5,69 | 2,69 |
| Jun | 1 352 610 | 8,19 | 5,57 | 2,62 |
| Jul | 2 152 052 | 8,75 | 5,88 | 2,87 |
| Aug | 6 673 418 | 9,05 | 5,80 | 3,25 |
| Sept | 3 160 300 | 9,05 | 5,92 | 3,13 |
(Source: SARS as supplied by Agri Inspec; European Commission)
To do a margin distribution as per column E, the other cost components of UHT processed milk manufacturing (excluding the cost of the unprocessed milk) need to be allocated:
- Manufacturing cost: R1,31/litre
- Packaging: R1,95/litre
- Transport from Warsaw to port of export: Gdynia: R0,25/litre
- Agents commission: R0,08/litre
- Profit margin: R0,30/litre
- Minimum margin shortfall is in August = R0,64/litre and maximum shortfall is in June = R1,27/litre.
- Other costs not included is the time value of money during storage and storage cost in the processing plant and losses.
The composition of the primary dairy industry in Poland with small dairy herds per farm raises the inevitable question of financial viability from a herd of 50 dairy cows.
The above two examples (Cheddar cheese and UHT processed milk) exhibit sufficient evidence to question the fairness of using imported dairy product prices as a basis to determine if the local milk market is competitive. Downstream value chain role players (the secondary and tertiary industries) that use this distortion as a departure point in price negotiations has severely damaged the primary dairy industry and will finally destroy the dairy industry in South Africa if this modus operandi goes on unchallenged.
The economic reality in the two dairy examples is enough evidence to approach the Ministry of Trade and Industry (with a Copy to the Minister of Agriculture, Land Reform and Rural Development) and motivate and request the appointment of a ministerial committee to investigate these economic realities and the effect on the South African dairy value chain. The MPO will use an intermediary to initiate the process.
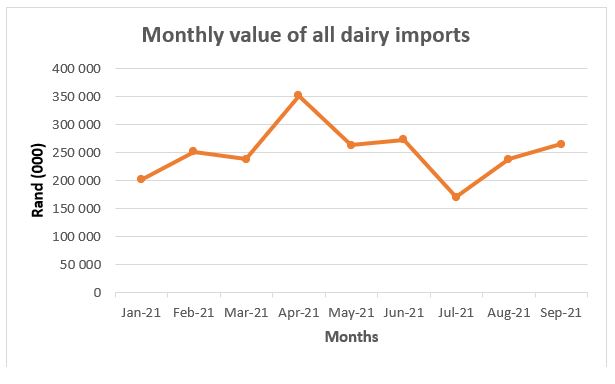
The total value of dairy imports over the period under review is illustrated in the graph below. The total value of dairy imports for the first nine months of 2021 was R2,3 billion.
Bertus van Heerden (chief economist, Milk Producers’ Organisation, MPO)
Johann Kirsten (Director: Bureau for Economic Research, Stellenbosch University)
Download the MPO pointer in PDF format here
Published on Thursday, 25th November 2021 - 13:59
Recent Posts
disclaimer